Fresh Pond Reservation Census Program
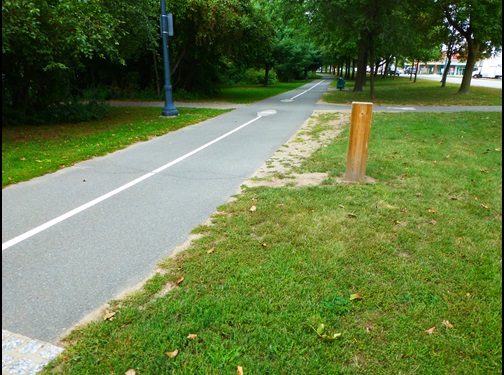
BP Multi sensor along the bike path. The sensor counts bikes and people passing by.
How it Works:
There are seven "Eco-Counter" sensor stations placed throughout Fresh Pond Reservation. Two are located along the Perimeter Road: one at the water treatment plant and the other near Little Fresh Pond. The water treatment plant sensor has the ability to differentiate between cyclists and pedestrian while the LFP sensor counts the aggregate number of users. There are also sensors at popular entrances to Fresh Pond: Black's Nook, Lusitania, the Community Gardens, and the hill by the golf course pro shop. An additional sensor capable of counting bikes and people is located on the bike path along Fresh Pond Parkway. These sensors help CWD quantify the majority of users entering and exiting the reservation, and whether the users are likely to be commuters or visiting for recreation. The Eco-Counter sensors tally both the number and direction of users by using a passive infrared sensor and a lens to detect small temperature changes caused by people passing the sensor. The sensors collect no other information. For quality control, data from the Eco-Counters are downloaded weekly and screened for anomalies. Staff and volunteers also conduct surveys of user type, group size, and travel direction periodically at Eco-Counter sensor locations. These surveys function as a quality check on the data collected by the Eco-Counter sensors and allow CWD to quantify different user types at Fresh Pond Reservation.
Results:
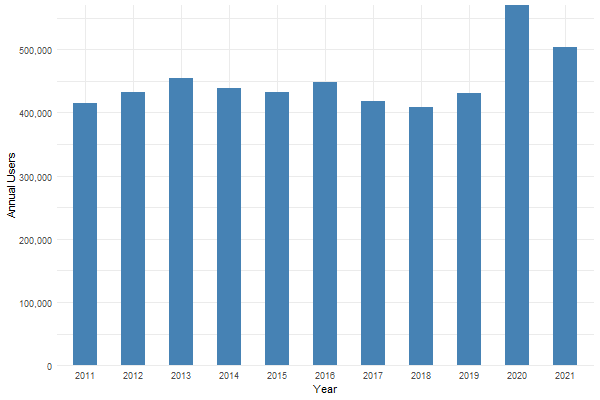
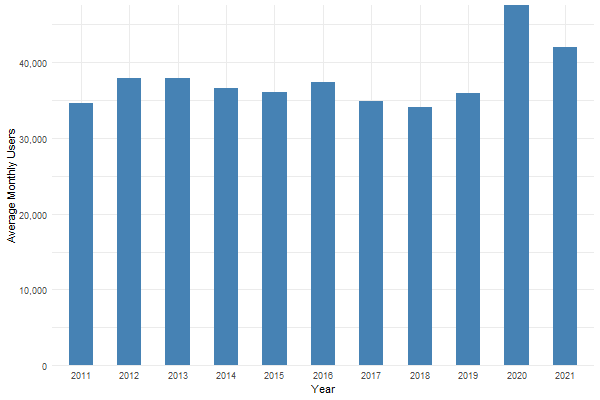
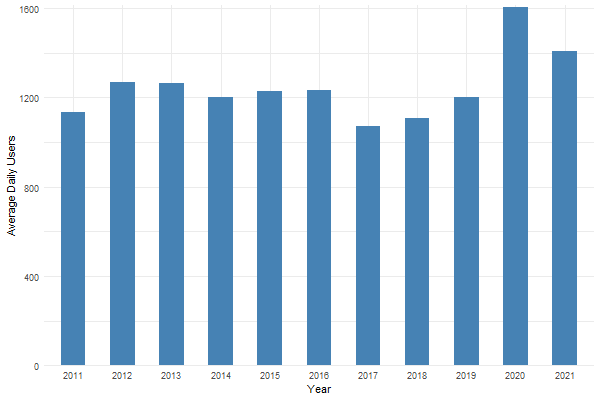
In 2021, an average of 41,897 people passed the sensors on the perimeter road of Fresh Pond Reservation every month and an average of 1,405 people visited every day. An average annual total of 502,760 people used the perimeter road in 2021. See the graphs below for average annual, monthly, and daily counts from sensors along the Fresh Pond Reservation perimeter road from 2011 through 2021. For detailed results, view the annual summary: EcoCounter Results, 2021
Fresh Pond Reservation Perimeter Road Average Annual Usership, 2011 - 2021
Fresh Pond Reservation Perimeter Road Average Monthly Usership, 2011 - 2021
 Fresh Pond Reservation Perimeter Road Average Daily Usership, 2011 - 2021
Visual Surveys:
The data collected from the Eco-Counter sensors are compared to tallied counts of walkers, runners, and cyclists from visual surveys done by staff and volunteers. This ability to compare sensor counts to actual observations is essential for ensuring the accuracy of the Eco-Counter data. Comparisons between the surveys and sensor results show that the sensors generally underestimate total user amounts, indicating that the Eco-Counters provide conservative estimates of reservation usage.
These data help inform shared use management strategies at Fresh Pond Reservation. If you like what you hear, consider volunteering as part of our census team!