An official website of the United States government
Here’s how you know
Official websites use .gov A
.gov website belongs to an official government
organization in the United States.
Secure .gov websites use HTTPS A
lock (
) or https:// means you’ve safely connected to
the .gov website. Share sensitive information only on official,
secure websites.
Cambridge tracks its greenhouse gas emissions every 5 years to understand where emissions come from and identify the best ways to reach net zero emissions by 2050. The City's most recent inventory shows community-wide greenhouse gas emissions declined 0.4% between 2019 and 2024 despite continued growth and development. Buildings remain the City's largest source of emissions.
Greenhouse gases are released when we use fossil fuels to heat, cool, and power our buildings, when we get around in gas-powered cars, and when food scraps and other organic waste breaks down in landfills. A greenhouse gas inventory is an estimate of the emissions generated by activities within a defined boundary, such as a city. To understand where emissions come from, inventories group them in two ways: by scope, which describes how the emissions are generated, and by sector, which describes the activity they come from.
Scopes:
Scope 1 includes direct emissions from sources located within Cambridge.
Scope 2 includes emissions from electricity, steam, heat, or cooling used in Cambridge but generated elsewhere.
Scope 3 includes certain emissions that happen outside the city as a result of activity within Cambridge, such as emissions from treating waste generated here.
Sectors:
Buildings include homes, commercial buildings, institutions, and other fixed sources that use electricity, natural gas, fuel oil, steam, and distribution losses.
Transportation includes emissions from cars, trucks, buses, and rail travel connected to activity in Cambridge.
Waste includes emissions from landfills, waste disposal, composting and other biological waste treatment, incineration, and wastewater treatment.
How Does Cambridge Do Greenhouse Gas Inventories?
Cambridge uses the year 2012 as a baseline for measuring greenhouse emissions. To estimate emissions as accurately and consistently as possible, the City follows established greenhouse gas accounting guidance used by cities around the world. Cambridge does two different types of greenhouse gas inventories: a community-wide inventory and a municipal inventory.
Community-wide Inventory
A community-wide inventory estimates emissions from activities across Cambridge as a whole. This includes emissions from buildings, transportation, and waste generated by residents, businesses, institutions, and other activity in the city.
Municipal Inventory
A municipal inventory calculates emissions from all energy sources used in City operations. This includes City vehicles; street lights and other outdoor lighting; buildings like schools, office buildings, and public safety facilities: water treatment and water and sewer pumping facilities. While municipal emissions are tracked separately, they are included in the community-wide inventory.
The two inventories serve different purposes and are not meant to be compared directly. The community-wide inventory helps Cambridge understand emissions across the city as a whole, while the municipal inventory helps the City track and reduce emissions from its own operations. Municipal emissions are included in the community-wide inventory, but they account for only a small share of Cambridge’s total emissions.
The City updates its municipal inventory more often because it has direct access to operational data such as utility bills, fuel use, and other City records. Community-wide inventories are larger and more complex, and draw on many different data sources to estimate emissions across Cambridge.
Cambridge is unique among cities of our size. The city is home to several large educational institutions, laboratories, and other energy-intensive industries, including bio- and pharmaceutical research. Our dense urban environment and sustainable transportation options help keep our transportation emissions a relatively small portion of our emissions. As a result, Cambridge’s greenhouse gas emissions are heavily concentrated in buildings.
In the most recent community-wide inventory, based on 2024 data, buildings accounted for about 89% of emissions, transportation accounted for about 9%, and waste accounted for about 2%. The single largest source of emissions, at 35%, was natural gas associated with commercial and institutional buildings, including both gas burned on-site and lost during distribution.
How Have Cambridge's Emissions Changed Over Time?
The guidance for how to conduct greenhouse gas inventories is regularly reevaluated as better data, tools, and methods become available. As a result, the way Cambridge calculated emissions in earlier inventories is not always the same as the way emissions are calculated today.
The City does its best to apply updated methods to previous inventories when possible, but differences in methodology and data availability can make it difficult to compare one year directly to another. For that reason, greenhouse gas inventories are most useful for understanding overall trends and major sources of emissions over time.
With that in mind, since 2012, our emissions have increased by about 15%. But from 2019 through 2024, we saw a slight decline in our emissions, by about 0.4%. The overall picture has remained consistent: buildings are by far the largest source of emissions, followed by transportation, while waste makes up a much smaller share.
Below, find graphs of Cambridge's emissions over time by sector.
Buildings
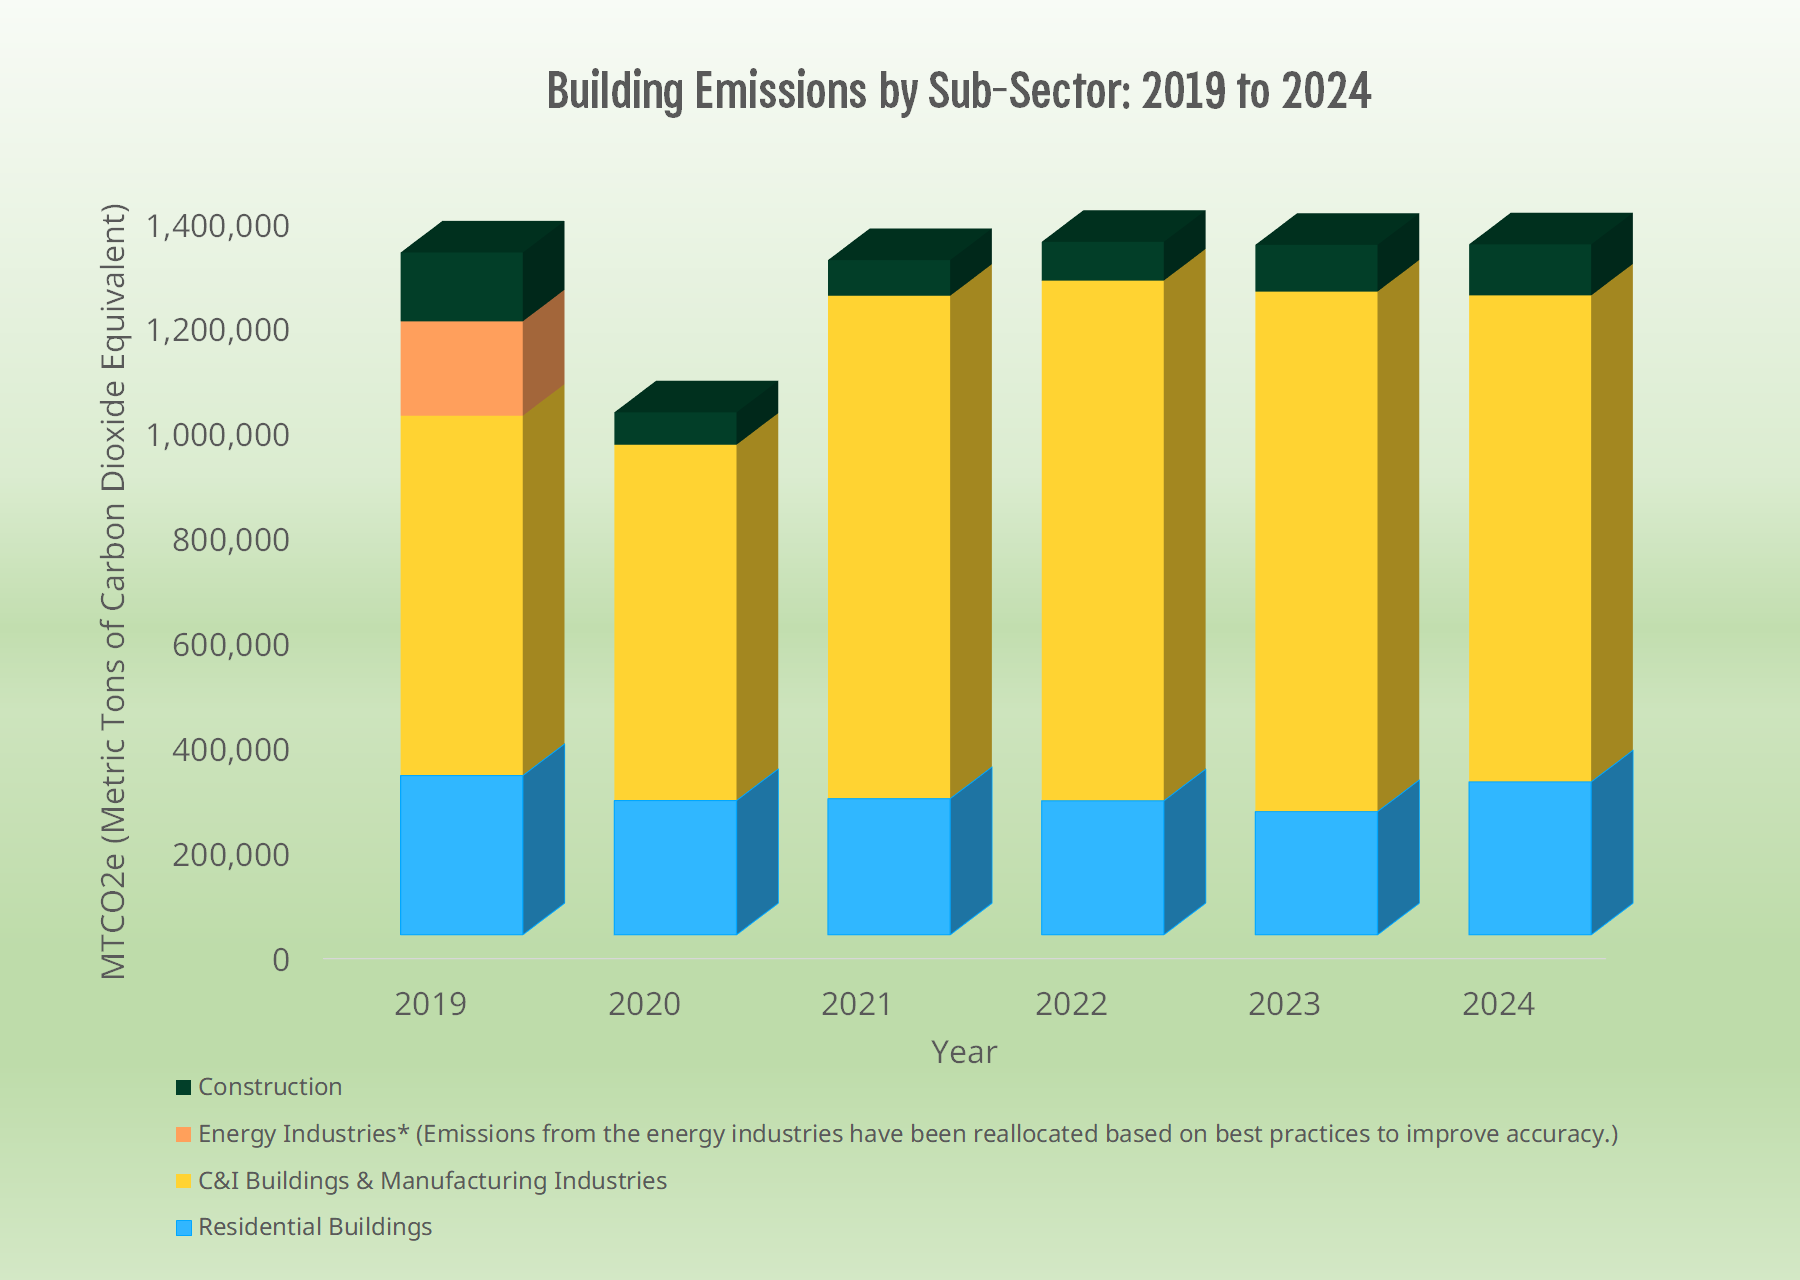
Buildings are by far the largest source of greenhouse gas emissions in Cambridge. These emissions come mainly from heating, cooling, and powering homes, businesses, labs, schools, and other buildings across the City. They are driven largely by commercial natural gas use, followed by electricity use, especially in commercial and institutional buildings.
The City organizes building emissions into three main categories: residential buildings, commercial and institutional buildings, and construction-related activities. These estimates are based on the energy used in buildings, including natural gas, electricity, district steam, and other fuels.
Cambridge's Net Zero Action Plan guides the City's efforts to lower emissions from buildings by improving access to clean energy and supporting planning for energy upgrades. The Building Energy Use Disclosure Ordinance regulates emission reductions from large non-residential buildings. Click here to learn more about the ordinance.
Transportation
Transportation emissions come from moving people and goods in and around Cambridge. This includes private passenger vehicles, commercial vehicles, City fleet vehicles, buses, and rail systems such as the MBTA.
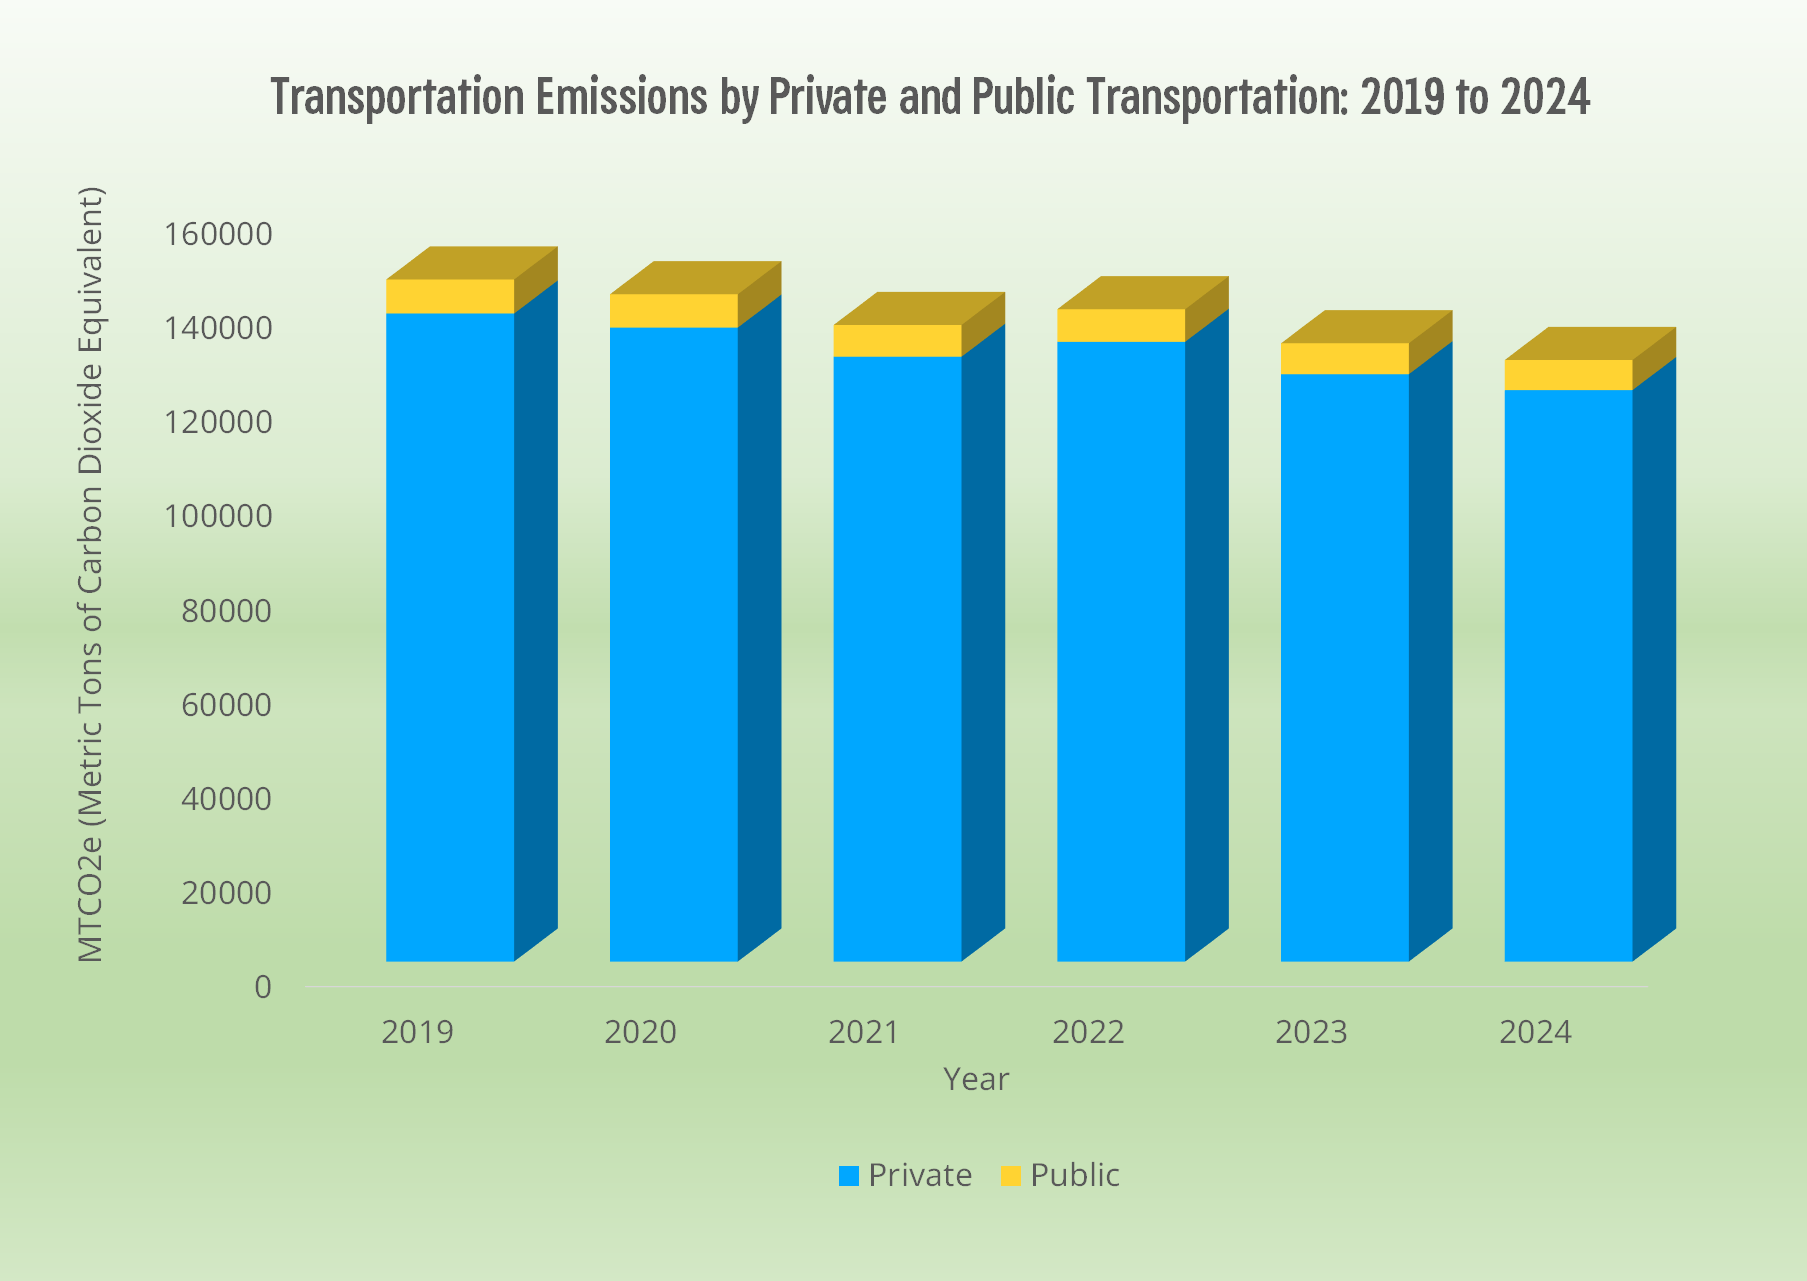
Most transportation emissions in Cambridge come from privately operated passenger and commercial vehicles, at 95%. The remaining 5% of emissions is generated from public transportation, both buses and rail.
Transportation emissions have decreased since 2019 largely due to improved fuel efficiency and the increased use of electric vehicles.
Cambridge's Zero Emissions Transportation Plan guides the City's efforts to address emissions from our transportation systems while making traveling around Cambridge safer and easier.
Waste
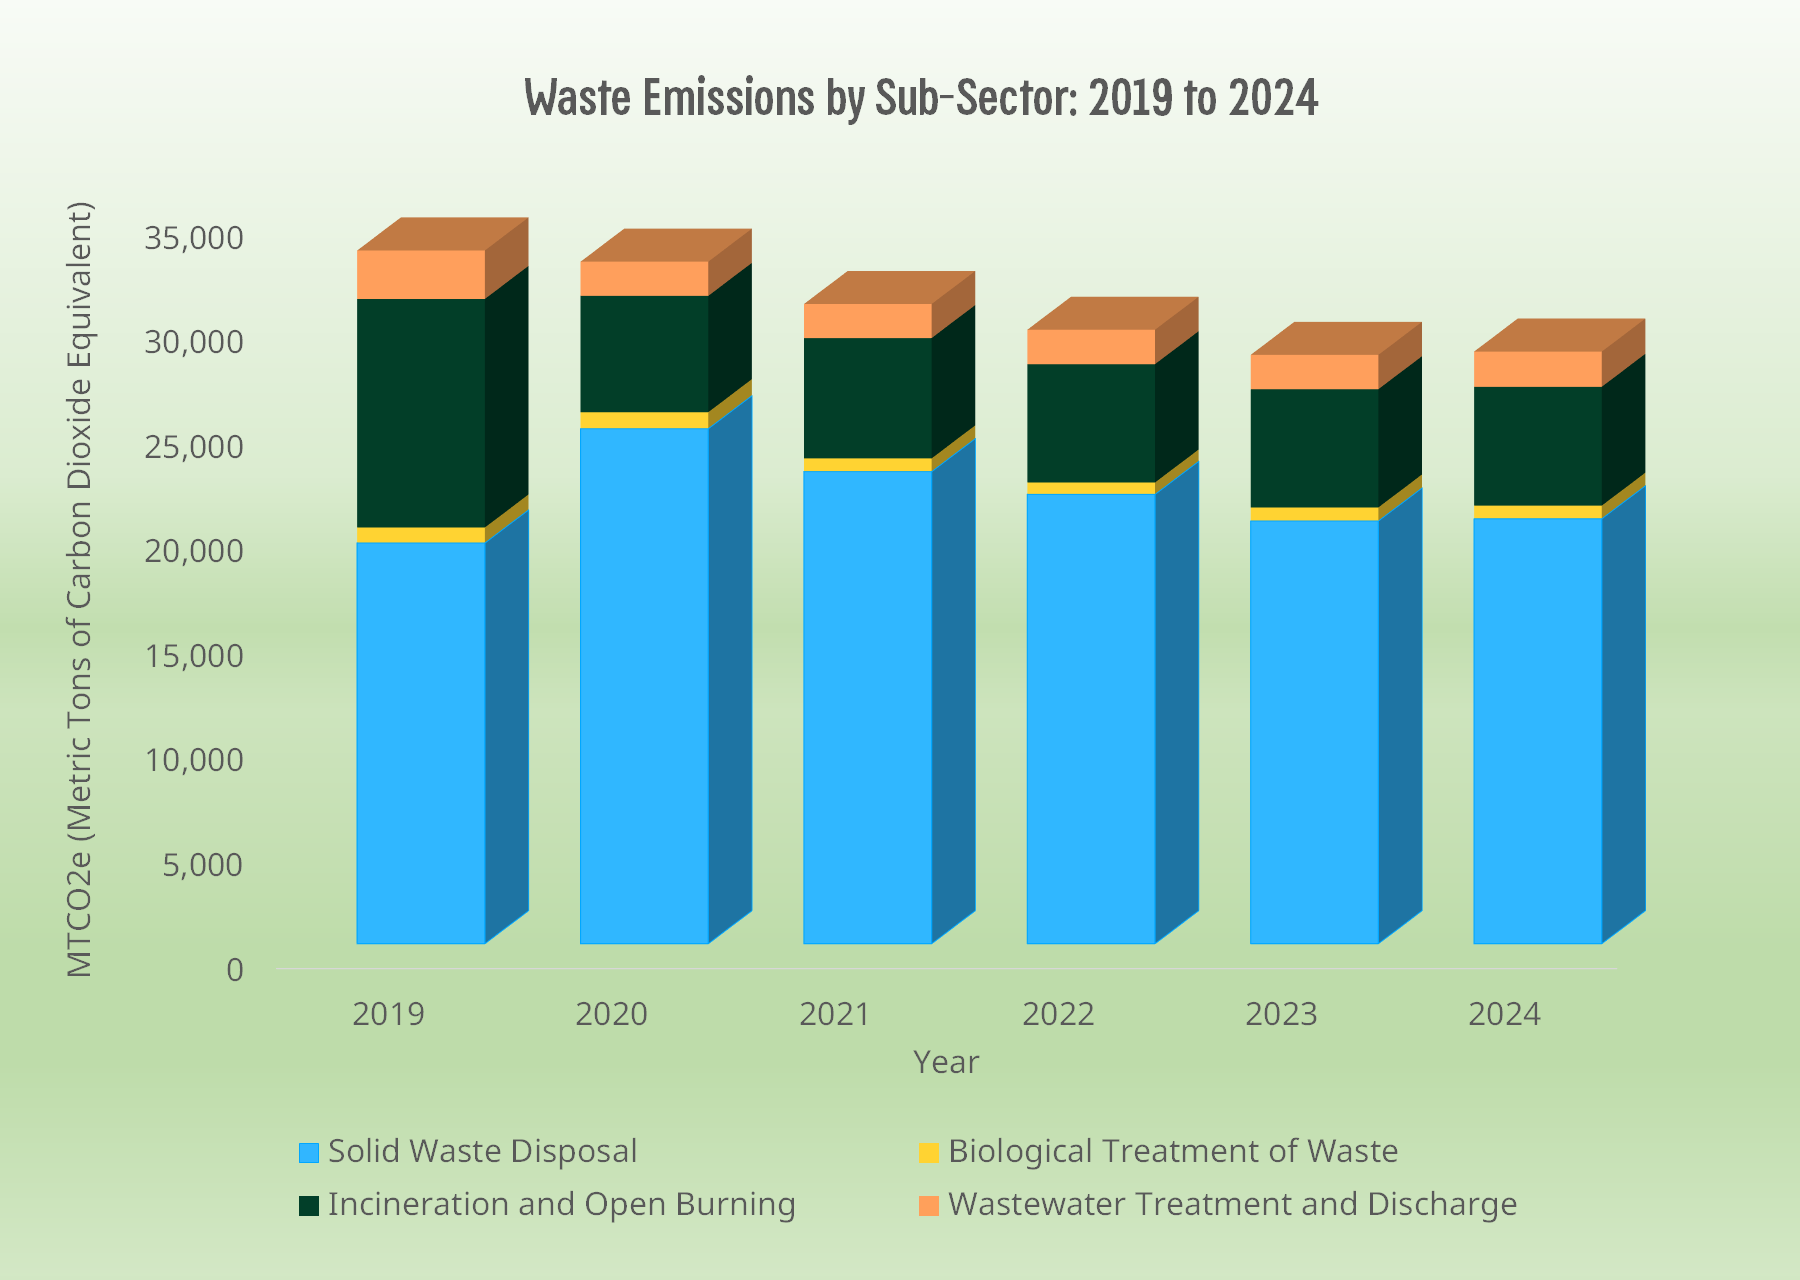
Waste emissions come from the handling and treatment of trash, food waste, wastewater, and other discarded materials generated in Cambridge. These emissions can come from landfills, incineration, wastewater treatment, and the treatment of organic waste.
The City organizes waste emissions into four main categories: solid waste disposal, treatment of biological waste, incineration, and wastewater. In the most recent inventory, the collection and disposal of solid waste was the largest contributor to waste-related emissions, at 72%.
Cambridge's Zero Waste Master Plan guides the City's efforts to lower emissions from waste by reducing the amount of trash we produce and improving recycling and food waste diversion efforts.
What Are Some Specific Findings from Cambridge’s Greenhouse Gas Inventories?
Community-wide inventories are complex. It will take some time for us to fully understand the inventory results, especially in regard to how other trends the City is experiencing relate to our emissions. We are curious to learn more about how our emissions are changing due to our growing population, increasing commercial real estate, and the impact of Cambridge policies targeting emissions reductions. Some recent findings include:
Emissions from electricity have decreased. This reflects a cleaner regional electric grid, along with programs such as Cambridge Community Electricity that increase the amount of renewable electricity serving Cambridge.
Emissions from natural gas have increased in residential and commercial buildings. Much of that increase reflects changes in how emissions were categorized in the most recent inventory, which makes direct comparisons to earlier inventories more difficult. Continued growth in Cambridge may also play a role, even as the City moves toward fossil fuel-free new construction.
Municipal operations account for only about 1% of Cambridge’s total community-wide emissions.
Even so, tracking those emissions remains important because it helps the City measure the impact of projects such as building upgrades, fleet electrification, and renewable electricity purchases. Click here to learn how the City is reducing emissions from municipal operations.
How Is Cambridge Reducing its Emissions?
Cambridge has committed to reaching net zero greenhouse gas emissions by 2050. To meet that goal, the City is working to:
Please provide as much detail below as possible so City staff can respond to your inquiry:
As a governmental entity, the Massachusetts Public Records Law applies to records made or received by the City. Any information received through use of this site is subject to the same provisions as information provided on paper.