Community Emissions
Community Greenhouse Gas Inventory
Greenhouse Gas Emissions Inventories
The Community wide GHG Inventory helps the City benchmark emissions. The City set a baseline using emissions from 2012 to measure reductions. Our Net Zero Action Plan established a goal for buildings to have zero emissions by 2050.
Inventories cover 3 main areas. These are Buildings and Energy, Transportation, and Waste. We measure emissions across 3 different scope.
- Scope 1: Emissions from fuels that are burned on site, and are directly controlled by an organization. For example, a gas-powered furnace that is used to heat a building. Another example would be a city fleet vehicle that is fueled by gasoline.
- Scope 2: Emissions from the generation of electricity, heat and steam. These emissions are not directly controlled by the reporting organization because the energy is purchased rather than produced. For example, the emissions that are produced at a power plant located outside of Cambridge that supplies electricity to a building in Cambridge.
- Scope 3: At a high level these are all of the other emissions that are not captured in Scope 1 or Scope 2. These emissions are the result of activity that takes place outside of the city, but as a result of activity within the city. For example, if an individual lives outside of Cambridge, but commutes into the city for work using a private vehicle. This falls into Scope 3 because the activity (driving to work in Cambridge) does not originate in Cambridge but is a result of something happening in the city (the location of their work). Other ways to think about scope 3 emission are the emissions generated from the goods we buy, use, and eventually throw away.
About the Community GHG Inventory
The most recent inventory covers data from the year 2019. The City is planning to conduct another community-wide inventory in 2025 covering data from the year 2024.
The community-wide inventory follows the Global Protocol for Community-Scale Greenhouse Gas Emission Inventories (GPC) developed by the World Resources Institute, C40 Cities, and ICLEI Local Governments for Sustainability and required by The Global Covenant of Mayors for Climate and Energy (GCoM), of which Cambridge is a member.
Community GHG Emissions Results
Community wide GHG emissions for the City of Cambridge were 1.41 million metric tons of carbon dioxide equivalent (MTCO2e) in 2019. The emissions were generated in the buildings, transportation, and waste management sectors.

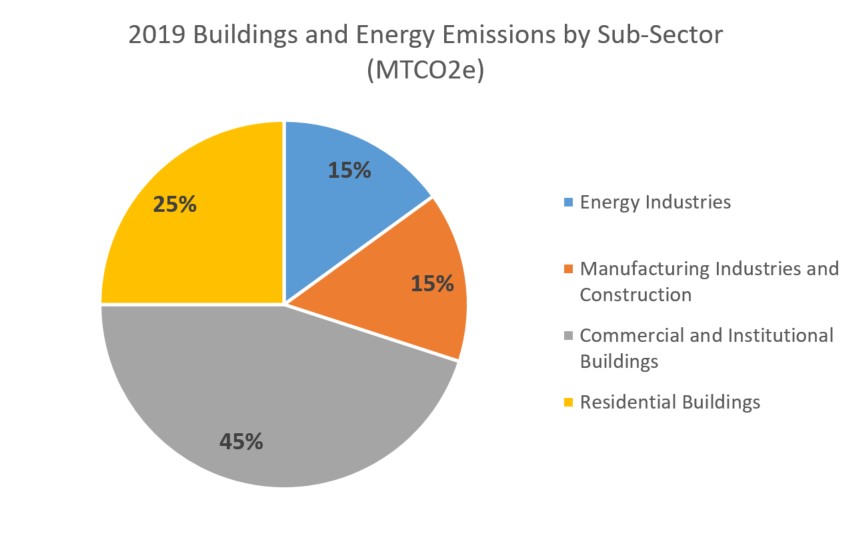
The 'Buildings and Energy' sector covers the buildings and energy generation in Cambridge. This accounts for the largest share of emissions at about 83%.
 .
.
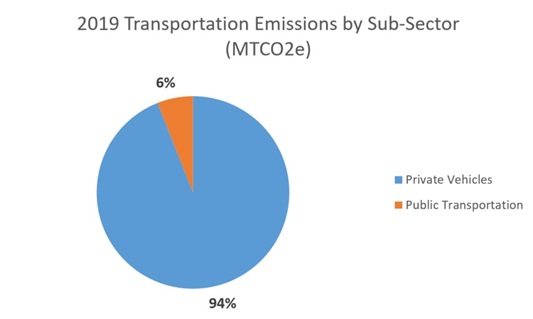
The transportation sector makes up about 10% of all our greenhouse gas emissions. These emissions are from the operation of private vehicles and public transportation.
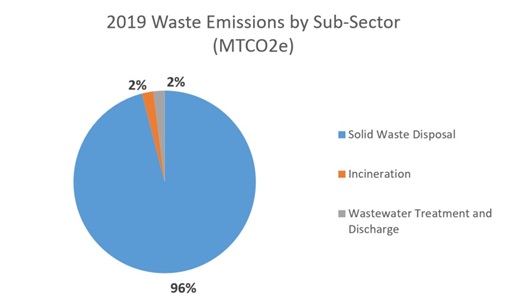
Emissions from waste account for about 7% of community-wide emissions. There are three main sources of emissions from waste: water, landfills and burning. Although only a small amount of our waste goes to landfill, it produces a majority of the emissions from this sector. Landfilled waste results in methane, which is a GHG that is far more potent than CO2. Burning mostly results in CO2.
Click here for the full 2019 Community GHG Inventory Report
Click here for methodology used to complete the 2019 Community GHG Inventory
Disclaimer*
Please note that, previously reported inventories may be inaccurate. During the 2019 inventory process, it was found that emissions in 2012 were lower than previously reported. A correction was made in the 2019 inventory with updated emissions for 2012.